Introduction
Statistical topics play a crucial role in various fields, from business and finance to healthcare and social sciences. Understanding statistics is essential for making informed decisions, analyzing data, and drawing meaningful conclusions. In this blog post, we will explore some key statistical topics that are relevant and widely used in today’s world.
Descriptive Statistics
Descriptive statistics involves summarizing and describing data using measures such as mean, median, mode, standard deviation, and range. These statistics help us understand the central tendency, variability, and distribution of a dataset. They provide a snapshot of the data and allow us to make comparisons and draw initial insights.

Inferential Statistics
Inferential statistics involves drawing conclusions or making predictions about a population based on a sample. It allows us to generalize findings from a smaller group to a larger one. Techniques such as hypothesis testing, confidence intervals, and regression analysis are commonly used in inferential statistics. By using these methods, we can make educated guesses and make decisions based on limited data.

Probability
Probability is the study of uncertainty and the likelihood of events occurring. It provides a framework for quantifying uncertainty and making predictions based on available information. Probability theory is used in various fields, such as insurance, gambling, and weather forecasting. Understanding probability helps us assess risks, make predictions, and make informed decisions.
Sampling Techniques
Sampling techniques are used to select a representative subset of individuals or objects from a larger population. These techniques ensure that the sample accurately reflects the characteristics of the population. Simple random sampling, stratified sampling, and cluster sampling are some commonly used methods. By employing appropriate sampling techniques, we can save time and resources while still obtaining reliable results.

Statistical Models
Statistical models are mathematical representations of real-world phenomena. They help us understand the relationship between variables and make predictions. Linear regression, logistic regression, and time series analysis are examples of statistical models used in different contexts. By fitting these models to data, we can uncover patterns, identify trends, and make forecasts.

Data Visualization
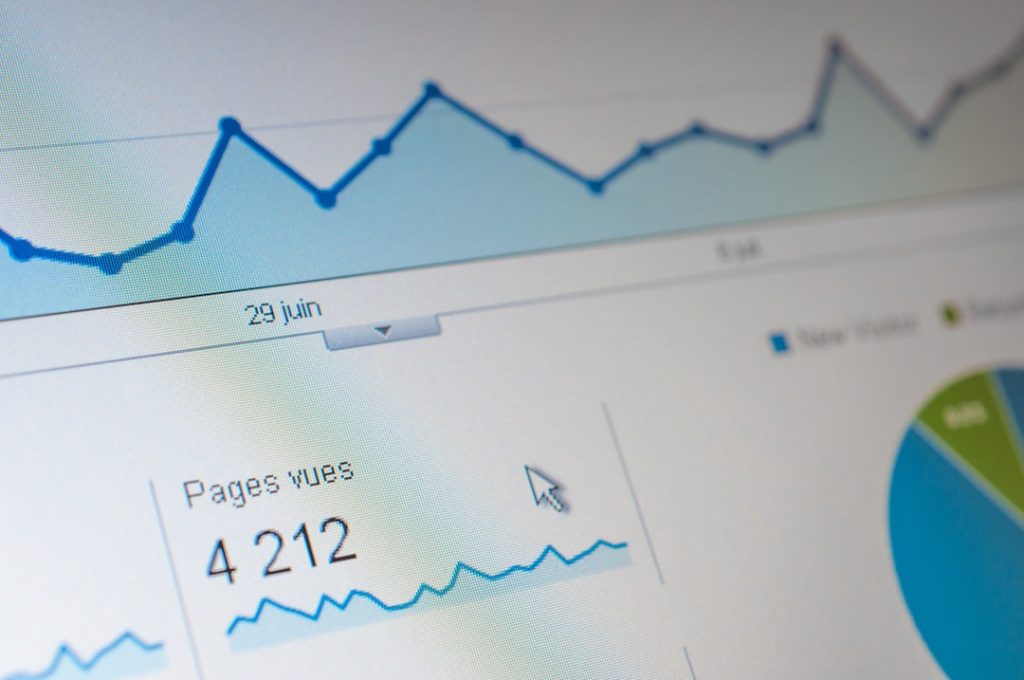
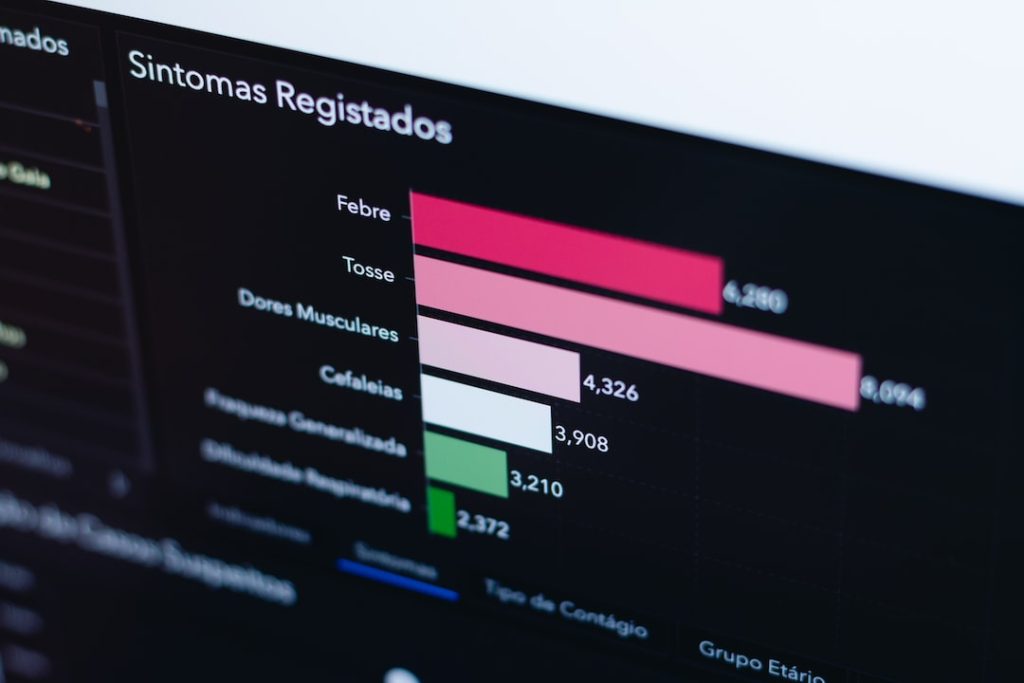
Data visualization is the graphical representation of data. It helps us understand complex information quickly and effectively. Charts, graphs, and maps are commonly used to visualize data. By presenting data visually, we can identify patterns, spot outliers, and communicate findings more easily. Data visualization is an essential tool for both exploratory analysis and presenting results.

Statistical Software
Statistical software simplifies the process of analyzing and interpreting data. Programs like R, Python, and SPSS provide a wide range of statistical tools and techniques. These software packages allow users to perform complex calculations, generate visualizations, and conduct statistical tests. Using statistical software enhances efficiency, accuracy, and reproducibility in statistical analysis.

Experimental Design
Experimental design involves planning and conducting experiments to gather data and test hypotheses. It includes factors such as sample size, randomization, and control groups. Proper experimental design ensures valid and reliable results. By carefully designing experiments, we can minimize bias, maximize statistical power, and draw meaningful conclusions.

Conclusion
Statistical topics are fundamental to understanding and interpreting data in various fields. Descriptive statistics, inferential statistics, probability, sampling techniques, statistical models, data visualization, statistical software, and experimental design are just a few examples of the many statistical concepts that play a crucial role in decision-making and analysis. By developing a solid foundation in statistics, individuals and organizations can make more informed choices and gain valuable insights from data.

